Table of contents
Real user monitoring (RUM)
When your site gets slower in the real world, you usually don't hear about it from dashboards first – you hear it from revenue: lower conversion rate, higher bounce, more cart abandonment, and more support tickets saying the site feels broken.
Real User Monitoring (RUM) is the practice of measuring performance using data collected from real visits on your site – real devices, real networks, real pages, and real user behavior – then aggregating that data into metrics you can track and act on (including Core Web Vitals).
What RUM reveals in production
RUM answers the question: Are real customers having a fast experience right now – and where is it failing?
Lab tests (like Lighthouse) are still useful, but they're controlled. RUM is not controlled – and that's the point. RUM captures things lab testing often misses:
- Device mix (cheap Android phones vs. high-end iPhones)
- Network reality (congested cellular, high latency regions, VPNs)
- Personalization (logged-in content, geo pricing, recommendations)
- Third parties that behave differently per user (A/B tests, ads, chat)
- Caching behavior (warm vs. cold cache, CDN variation)
If you're deciding between "optimize hero image" and "reduce third-party scripts," RUM helps you avoid fixing the wrong thing.
For context on this difference, see Field vs lab data and Measuring Web Vitals.
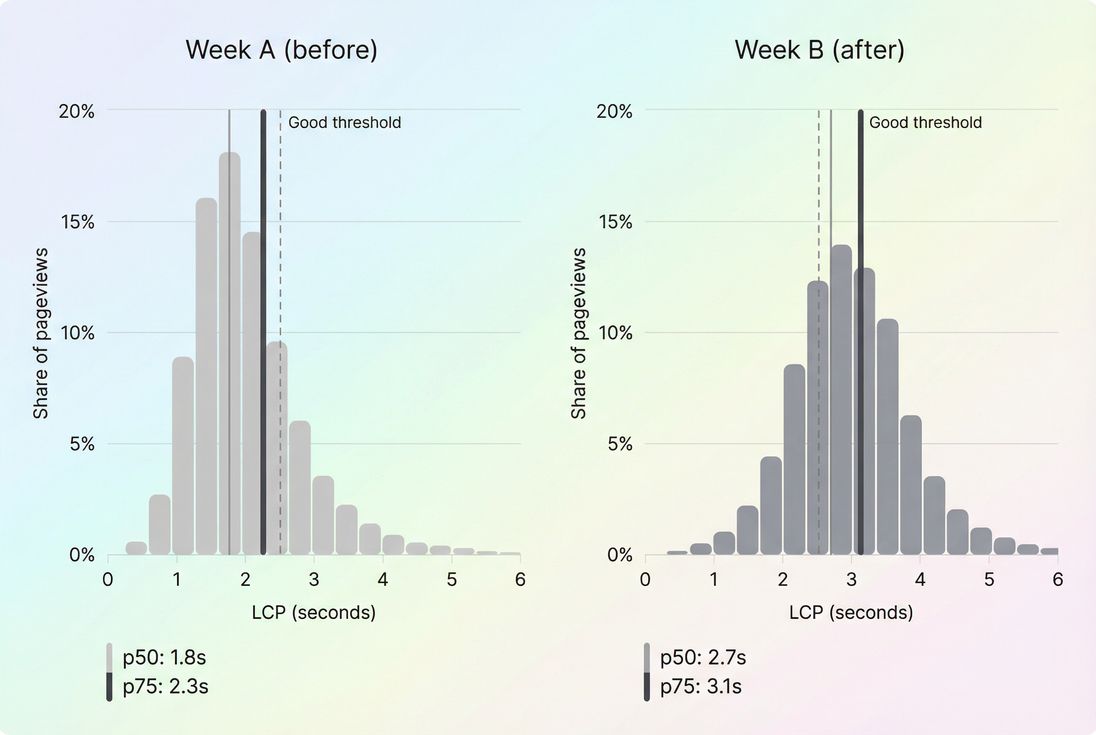
A RUM distribution view shows whether a regression hurt a small tail of users or shifted the typical experience (p75), which is what Core Web Vitals scoring and real conversions tend to follow.
The Website Owner's perspective: RUM is how you stop guessing. If performance drops only on mobile in one country after an ad partner update, you can treat it like an incident – not a multi-week redesign project.
What RUM measures for websites
Most website owners use RUM primarily for Core Web Vitals and a few supporting metrics that explain why the vitals moved.
The core metrics to prioritize
RUM commonly tracks:
- LCP (loading experience): see Largest Contentful Paint
- INP (interactivity): see Interaction to Next Paint
- CLS (visual stability): see Cumulative Layout Shift
A practical benchmark table (Google's widely used thresholds):
| Metric | Good | Needs improvement | Poor |
|---|---|---|---|
| LCP | ≤ 2.5s | 2.5–4.0s | > 4.0s |
| INP | ≤ 200ms | 200–500ms | > 500ms |
| CLS | ≤ 0.10 | 0.10–0.25 | > 0.25 |
(Overview: Core Web Vitals.)
The supporting metrics that explain changes
When a vital regresses, you usually need supporting signals to avoid blind optimization:
- TTFB to separate server/CDN problems from front-end problems: Time to First Byte, CDN vs origin latency
- Resource and request pressure: HTTP requests, JS bundle size
- Main-thread pressure (often correlates with INP issues): Long tasks, Reduce main thread work, JavaScript execution time
- Render blocking (often correlates with slow LCP): Render-blocking resources, Critical CSS
- Third-party impact: Third-party scripts
What influences RUM values (in plain terms)
RUM metrics move when your users' reality changes. Typical causes:
Backend or caching shifts
- origin slowdown, database contention, cache misses
- CDN configuration changes
- ineffective caching headers (Cache-Control headers, Browser caching, Edge caching)
Front-end weight and priority changes
- larger images or worse formats (Image optimization, WebP vs AVIF)
- render-blocking CSS/JS changes (Unused JavaScript, Unused CSS)
- loading order mistakes (Async vs defer, Preload, Preconnect)
User mix changes
- more mobile traffic, more international traffic, more first-time visitors
- campaigns sending lower-end devices and slower networks
RUM doesn't just tell you "it got worse." It helps you answer what kind of worse and for whom.
How RUM numbers are calculated
RUM isn't one number. It's many measurements per visit, rolled up into distributions.
Step 1: collect per-visit measurements
A typical RUM implementation runs JavaScript in the browser to capture:
- Web Vitals events (LCP, INP, CLS)
- Navigation timings (including TTFB)
- Context dimensions (URL or route, device type, viewport, connection type, country inferred from IP on the collector side)
Each pageview contributes one data point per metric (sometimes more, depending on the metric definition and the page lifecycle).
Step 2: aggregate into percentiles (why p75 is common)
Because performance is "spiky" across users, RUM tools usually report percentiles:
- p50 (median): what a typical user experiences
- p75: what the slower-but-still-common user experiences
- p95/p99: long-tail pain (important for incident response, less for CWV scoring)
p75 is widely used because it is:
- stable enough to trend,
- sensitive enough to catch broad regressions,
- aligned with how Core Web Vitals "pass" is commonly assessed.
Step 3: segment (the step most owners underuse)
If you only track a site-wide p75, you will waste time. Segment early by:
- Page type/template: homepage vs. PDP vs. collection vs. checkout
- Device: mobile vs. desktop (and sometimes tablet)
- Geography: your top revenue countries
- Navigation type: new session landing vs. internal navigation (especially for SPAs)
This is where RUM becomes operational, not just a reporting artifact.
A note on "calculation" pitfalls
RUM values can be misleading if you don't account for:
- Sampling: Some tools sample traffic; sudden sampling changes can look like a regression.
- Consent banners and blockers: If the RUM script is blocked or delayed, you may measure a biased set of users (often more technical, faster devices).
- SPA routing: If your app updates content without full navigations, you need to ensure route changes are tracked properly, or you'll miss problems on "pages" that aren't full loads.
The Website Owner's perspective: Don't accept "site-wide is fine" as an answer. A checkout regression that affects 20% of sessions can be invisible in a blended site average – and still cost real money.
How to diagnose a regression quickly
When RUM changes, your job is to turn "numbers moved" into a short list of likely causes.
1) Confirm it's broad, not just noise
Before you launch a performance war room:
- Check sample size (especially for smaller sites)
- Compare p50 and p75:
- If only p95 worsened, it might be an edge-case (still worth fixing, but prioritize differently).
- If p50 and p75 both worsened, it's usually a real systemic issue.
2) Find the segment that moved the most
This is the fastest path to root cause.
Example playbook:
- Filter to mobile only
- Compare top templates
- Then compare top countries
- Then compare entry pages vs internal nav
A regression that appears only on:
- mobile + product pages often points to heavier JS, third-party tags, or image changes
- all pages + all devices often points to CDN/origin latency or a caching failure (Server response time, CDN performance)
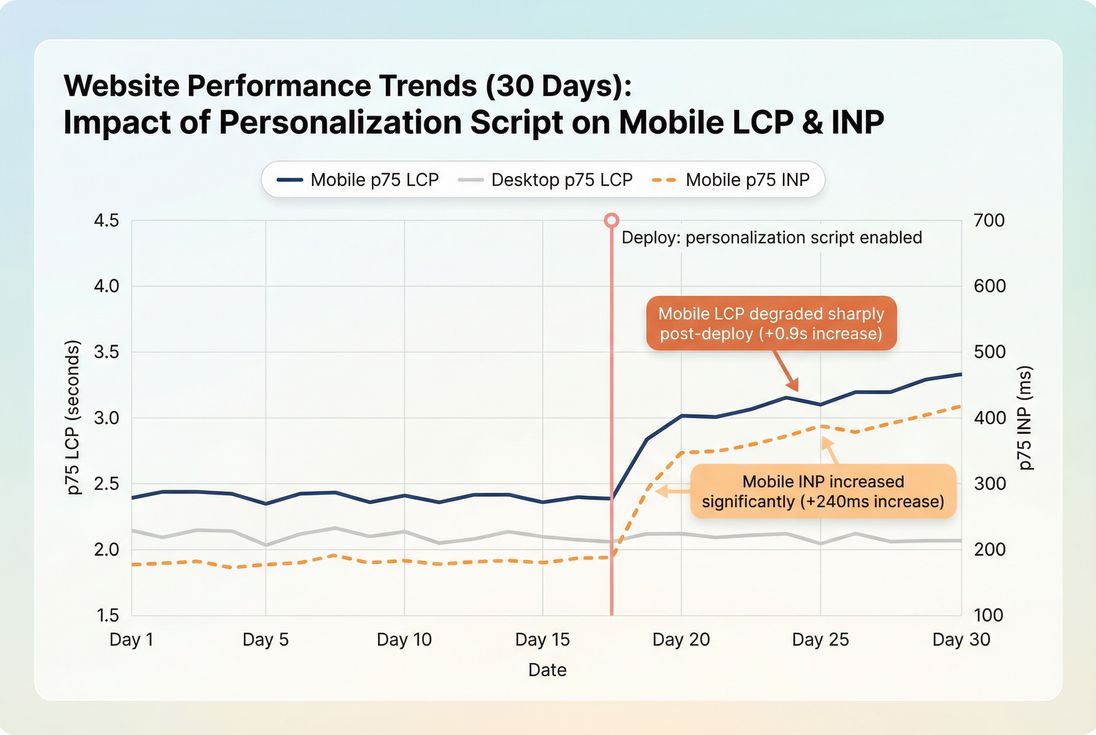
A RUM time series with segmentation and deploy markers helps you separate true regressions from normal variability and ties changes to operational events.
3) Translate the symptom into likely technical causes
Use the metric to guide your next investigation:
LCP worsened
- Check TTFB first: origin/CDN/cache issues can drag everything down (TTFB, Effective cache TTL)
- Then check above-the-fold weight and priority: images, CSS, fonts (Above-the-fold optimization, Font loading, Critical rendering path)
INP worsened
- Look for long tasks, heavier JS, or third-party contention (Long tasks, Third-party scripts)
- Common triggers: tag manager changes, A/B testing, personalization, chat widgets
CLS worsened
- New banners, lazy-loaded content without reserved space, font swaps, injected third-party widgets (Layout instability, Zero layout shift)
4) Reproduce with lab tests (but use RUM to aim)
RUM is excellent for identifying:
- which page/template,
- which device class,
- which region/network profile,
- which time window.
Then you reproduce with synthetic tests (Lighthouse/WebPageTest-style) using similar conditions so you can see waterfalls and CPU work. That workflow is the practical bridge between field truth and fixable evidence. (See PageSpeed Insights and Web performance metrics.)
How website owners use RUM to decide what to fix
RUM becomes valuable when it directly changes priorities, not just reporting.
Prioritize by business impact, not just worst metric
A simple prioritization matrix works well:
- Pick 5–10 revenue-critical templates (PDP, category, cart, checkout, account).
- For each template, look at:
- traffic share
- p75 LCP / INP / CLS
- recent trend (7–14 days)
- Fix items where many sessions are affected and the page is near a threshold (because crossing thresholds can change outcomes fast).
For example:
- Reducing LCP from 4.5s to 3.8s is good.
- Reducing LCP from 2.7s to 2.4s can be more important if it moves you into "Good" for a large portion of traffic.
Use RUM to set performance budgets that stick
Budgets fail when they're arbitrary. RUM-based budgets are grounded in user reality:
- Keep p75 LCP under a target for your top templates.
- Keep p75 INP under a target for pages with heavy interaction (filters, search, cart).
- Alert on regressions, not just absolute numbers.
More on budgets: Performance budgets.
Segment to find "cheap wins"
Often the fastest wins are not global rewrites – they're targeted fixes:
- One region is slow → fix CDN routing, add edge caching, reduce origin dependence (Edge caching)
- Only mobile is slow → reduce JS execution and third-party load on mobile breakpoints (JS execution time)
- Only first-time landings are slow → improve caching, compression, and critical resource priority (Brotli compression, Gzip compression, Preload)
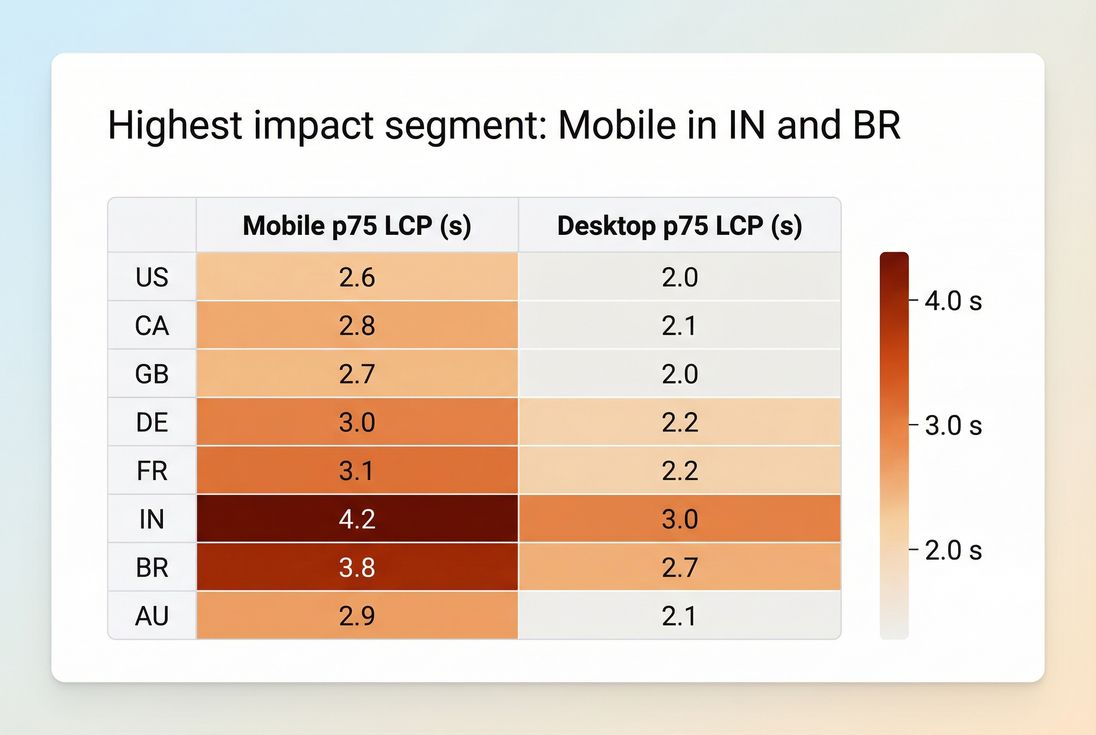
Segmentation turns a vague performance problem into a specific target: which country and device combination is driving the majority of the p75 pain.
The Website Owner's perspective: This is where RUM pays off: you can fund performance work like any other business investment – target the segment that's both slow and valuable, validate improvement, and keep it from regressing.
Common interpretation traps (and how to avoid them)
- Trap: celebrating the median
- If median improves but p75 worsens, more users may be suffering even while "typical" looks better.
- Trap: using site-wide averages
- Template-level tracking is usually the minimum for useful decisions.
- Trap: ignoring third parties
- Many regressions come from tag managers and vendors. RUM helps you prove impact and negotiate changes.
- Trap: overreacting to a single day
- Use 7-day views for stability, but keep the ability to zoom into incident windows.
Using RUM with PageVitals reporting
RUM is an industry-standard approach; the key is how quickly you can slice the data, connect it to releases, and validate fixes.
If you're using PageVitals field testing, these docs are the most relevant for understanding how the data is viewed and filtered:
- Field testing overview: /docs/features/field-testing/
- Web Vitals field testing reports: /docs/features/field-testing/web-vitals/
- Filtering field data (critical for segmentation): /docs/features/field-testing/using-filters/
- Metric references often used alongside RUM:
A practical RUM operating rhythm
- Daily (10 minutes): check p75 vitals for top templates; look for sudden shifts.
- Weekly (30–60 minutes): review worst segments (device/country/template) and create 1–3 actionable tickets.
- Per release: compare pre/post windows to catch regressions early; enforce a budget mindset.
If you treat RUM as an operational signal – not just a monthly SEO report – you'll catch performance issues while they're still cheap to fix.
Frequently asked questions
Yes, if you make decisions based on real customer experience. Lighthouse and PageSpeed Insights are lab-style snapshots under controlled settings. RUM shows what happens across real devices, networks, geographies, and logged-in states. Use lab tests to reproduce issues; use RUM to confirm impact and prioritize.
For Core Web Vitals decisions, p75 is the most useful because it reflects typical slower experiences, not just best-case visitors. Averages hide long tails, and medians can look healthy while many users still struggle. Track p75 for reporting and median for quick directional checks during debugging.
You can learn from RUM quickly, but reliability depends on volume and segmentation. For a single key page, hundreds of pageviews per day can show trends; smaller sites may need weekly views. Avoid over-segmenting early. Focus first on top templates and top countries or devices.
Start by ranking pages by business value and traffic, then overlay p75 LCP, INP, and CLS. Prioritize fixes where many sessions are affected and the page is revenue-critical, like product, cart, and checkout. Use segmentation to find the worst device or country and target improvements there first.
Common causes include third-party script changes, ad or tag container updates, CDN cache misses, origin slowdowns, traffic mix shifts to mobile, and regional network problems. Also check measurement changes like consent banners blocking data or sampling changes. Segment by page, device, and geography to pinpoint the driver.
Want to take PageVitals for a spin?
Page speed monitoring and alerting for your website. Get daily Lighthouse reports for all your pages. No installation needed.
Start my free trial